

With the advent of technology, trading has evolved with superfast computers trading with each other at unimaginable speeds every second today. Traders have developed several tools to keep up with this high speed of the trading business. One such term is the volatility of a stock. The volatility of an underlying stock measures the risk of the security of the stock. Volatility is often measured as either the standard deviation or variance between annualized returns over a given period of time from the same security or market index.
Volatility indicates the pricing behavior of the security and helps estimate the fluctuations that may happen in a short period of time. There are several ways to measure volatility, including beta coefficients, option pricing models, and standard deviations of returns. Even though there are several ways to measure volatility, options traders generally work with two metrics: implied volatility and historical volatility. Volatility is an important variable for calculating options prices. A more volatile underlying stock is considered to be riskier as the price is less predictable. The article below provides the reader with information about implied volatility and historical volatility and the difference between them.
What is Historical Volatility?
When you are researching about a company, what would you check out first? The fluctuations in its returns over a period of time historically, right? Historical volatility gauges the fluctuations of underlying securities by measuring price changes over predetermined periods of time. Depending on the intended duration of the options trade, Historical volatility can be measured in increments ranging anywhere from 10 to 180 trading days. By comparing the percentage changes over longer periods of time, investors can gain insights on relative values for the intended time frames of their options trades
- When a security’s Historical Volatility is rising, or higher than normal, it means prices are moving up and down farther/more quickly than usual and is an indication that something is expected to change, or has already changed, regarding the underlying security (i.e. uncertainty). You may want to research/monitor the security more closely.
- When a security’s Historical Volatility is falling, things are returning back to normal (i.e. uncertainty has been removed).
What is Implied Volatility?
While historical volatility looks at the past records, Implied Volatility(IV) allows Options Traders to make a determination of just how volatile the market will be going forward. Implied volatility comes from the price of an option and represents its volatility in the future. Because it is implied, traders can’t use past performance as an indicator of future performance. Instead, they have to estimate the potential of the option in the market. An option’s Implied Volatility can help serve as a measure of how cheap or expensive it is. Learn more about how to screen stocks using their Implied Volatility with MarketXLS here.
Frequently, an option that has a very large increase in implied volatility (exploding IV) is one where the company of the underlying stock has an announcement forthcoming, such as an earnings report or another major company pronouncement. Of the top 10 screen results that appeared in the exploding IV screen in December 2020, all 10 were scheduled to report earnings within the next 7 days. This suggests that companies reporting earnings will commonly experience an increase in implied volatility.
Relevance of Implied vs Historical volatility
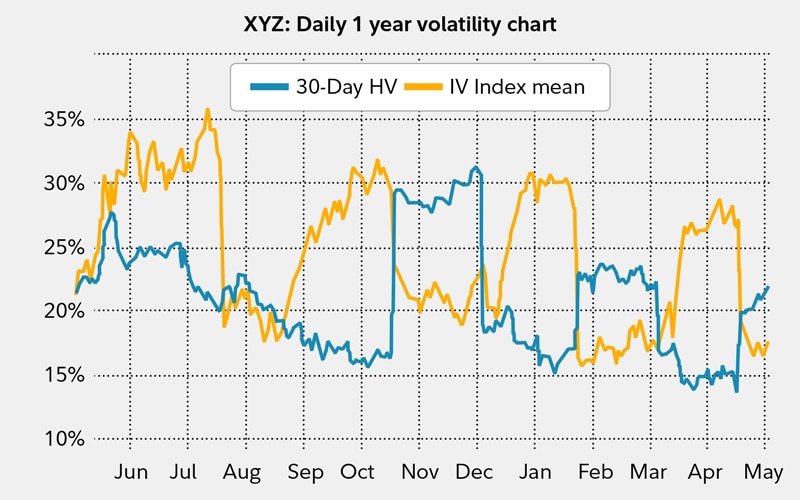
When you are considering a particular options contract and are evaluating its volatility, one helpful strategy may be to look at a chart of an option’s implied volatility compared with its historical volatility. Consider the chart below, where a recent increase in implied volatility (orange line) in mid-March was followed by an increase in observed historical volatility (blue line) in mid-April.
A suitable example to understand their relevance would be that when implied volatility is significantly higher than the average historical levels, options premiums are assumed to be overvalued. Higher-than-average premiums shift the advantage to options writers, who can sell to open positions at inflated premiums indicative of high implied volatility levels. Under these circumstances, the objective is to close positions at a profit as volatility regresses back to average levels and the value of options premiums declines. Using this strategy, traders intend to sell high and buy low.
Options buyers, on the other hand, have an advantage when implied volatility is substantially lower than historical volatility levels, indicating undervalued premiums. In this situation, a return of volatility levels to the baseline average can result in higher premiums when options owners sell to close positions, following the standard trading objective of buying low and selling high.
Disclaimer
None of the content published on marketxls.com constitutes a recommendation that any particular security, portfolio of securities, transaction, or investment strategy is suitable for any specific person.
The author is not offering any professional advice of any kind. The reader should consult a professional financial advisor to determine their suitability for any strategies discussed herein.
The article is written for helping users collect the required information from various sources deemed to be an authority in their content. The trademarks if any are the property of their owners and no representations are made


