
How Can We Help?
Stock Screener In Excel
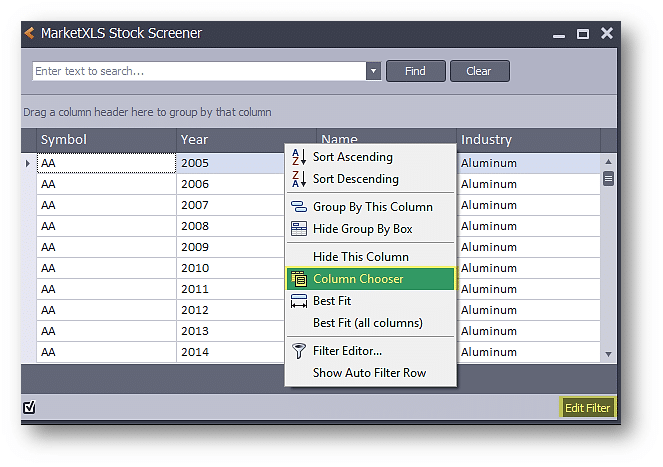
Use MarketXLS Stock Screener in Excel to screen 10-year key ratios and fundamental metrics of stocks. Depending on the speed of your PC and your internet connection screener form can take 5-15 seconds to load as it loads the data. By default only basic columns are shown but you can add as many columns to you want by clicking on any Column header and clicking on “Column Chooser”.
Whatever is available in the screener form can be copied and pasted in Excel sheet by using usual shortcuts like CTRL+C and CTRL+V. To copy the rows click on the small row arrow, select the rows, press CTRL+C and then go to Excel, select a cell and press CTRL+V.
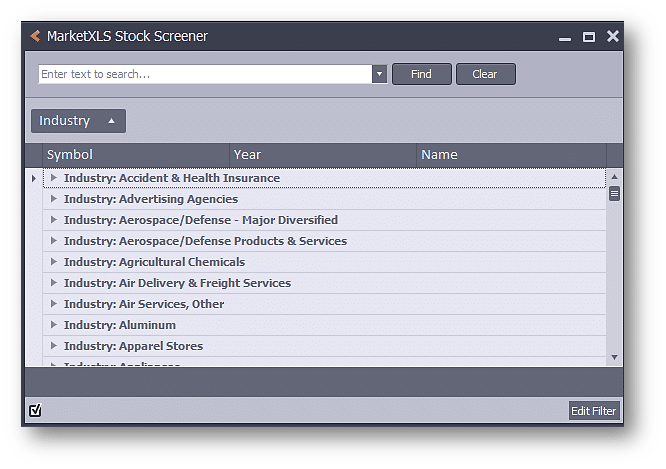
The data can be grouped by any column by simply dragging a column header to the form’s header area.
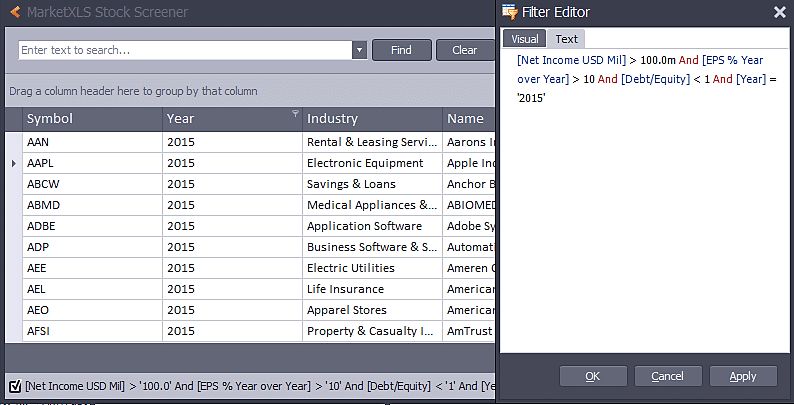
You can click on “Edit Filter” to filter stocks by various parameters in the database. Both visual mode and text mode is supported in the screener. The screener can be maximized to have a full view on the screen.
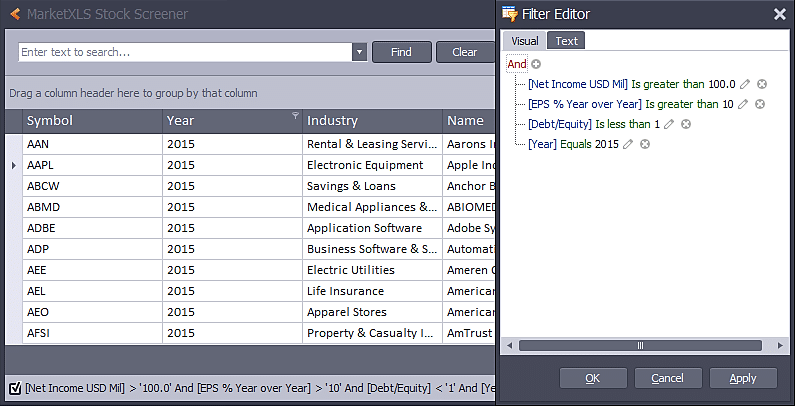
The filters are nothing but rules and the text versions of filters can be saved by simply copying and pasting filer rules.
The data in the database is updated on a quarterly basis.
The stock screener can go a long way in helping you scan and identify stocks that are suitable for your needs based on your criteria, your risk profile and your existing portfolio. There are thousands of stocks with each stock having tons of information. this makes the process extremely time consuming. the advantage with a stock screener in excel is that you don’t have to leave the comfort of your excel sheet to research these stocks. All the data and filters and metrics are available right there. Learn more about MarketXLS Stock Screener functionality.


