
How Can We Help?
RSI Screeners in Excel using MarketXLS
The RSI screener in excel by MarketXLS scans the whole market and collect all the Overbought and Oversold stocks and brings this list of stocks to your excel sheet. Let’s look at what RSI is and how the screener works.
What is the RSI indicator?
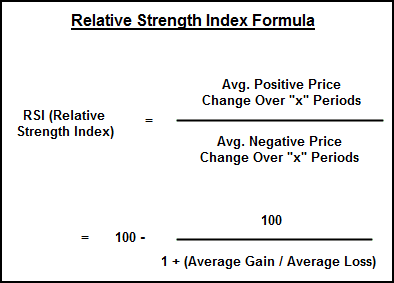
RSI (Relative Strength Index) compares magnitude of recent gains to recent losses to determine overbought or oversold conditions.
RSI or Relative Strength Index is one of the most popular momentum indicator in Technical Analysis. It’s value fluctuates between 0 to 100 and indicates the strength and velocity of price move. RSI indicator is mostly calculated on 14 period timeframe and any value above 70 indicates over-brought level and value below 30 indicates over-sold level. However, there are many variations of this indicator and the manner in which the RSI levels are interpreted varies with your trading style.
How to use MarketXLS RSI Screener in Excel?
Every day on our servers we run the RSI indicator for daily close prices for all US stocks and store them in our databases. So, essentially we screen the whole market and collect all the Overbought and Oversold stocks. This list can be obtained using MarketXLS RSI Screener as shown in the following video:
Using the stock screener in excel, you can get a list of RSI 14-day overbought stocks and RSI 14-day oversold stocks. This saves a lot of time as you can pull this list right within your excel sheet and use the data in your stock research. Once you have the list of these stocks, you can take advantage of other MarketXLS functions get more information about the stocks within the list. For example, you can select multiple of these stocks, and get their price history or look up their fundamental data.
Learn about all screeners provided by MarketXLS.


