

Technical Indicators’ analysis is the study of historical data to estimate futuristic trends and fluctuations in the prices of stocks. It is used to determine the entry and exit points in the market. There are various economic indicators for estimating economic growth in the future, like GDP & GNP. Similarly, in the stock market, we have technical indicators, which help forecast and estimate futuristic movements and fluctuations in the prices of stocks. Day traders and swing traders, who execute trades on an intraday basis, generally use these indicators. These indicators are constructed on the basis of historical prices and volumes. There are thousands of technical indicators out there in the market, but not all of them might be useful. In this article, we will look at some of the most important and valuable technical indicators. After going through this article, you will understand:
- How to interpret various technical indicators
- How MarketXLS helps you identify and interpret these indicators, and how it helps you make better investment and trading decisions.
We will be looking at the following indicators:
- Bollinger Bands
- Simple Moving Average
- Exponential Moving Average
- Golden Cross
- Death Cross
- Moving Average Convergence Divergence (MACD)
- Relative Strength Index (RSI)
Bollinger Bands

Bollinger band is a band drawn around the prices depicted on the chart. It tells you that the price should remain within those bands at a certain probability.
Ways of Interpretation:
If the stock price goes beyond the range of the band, there is a certain probability that it might come back and correct itself at a price that is within the range of the band.
Simple Moving Average (SMA)
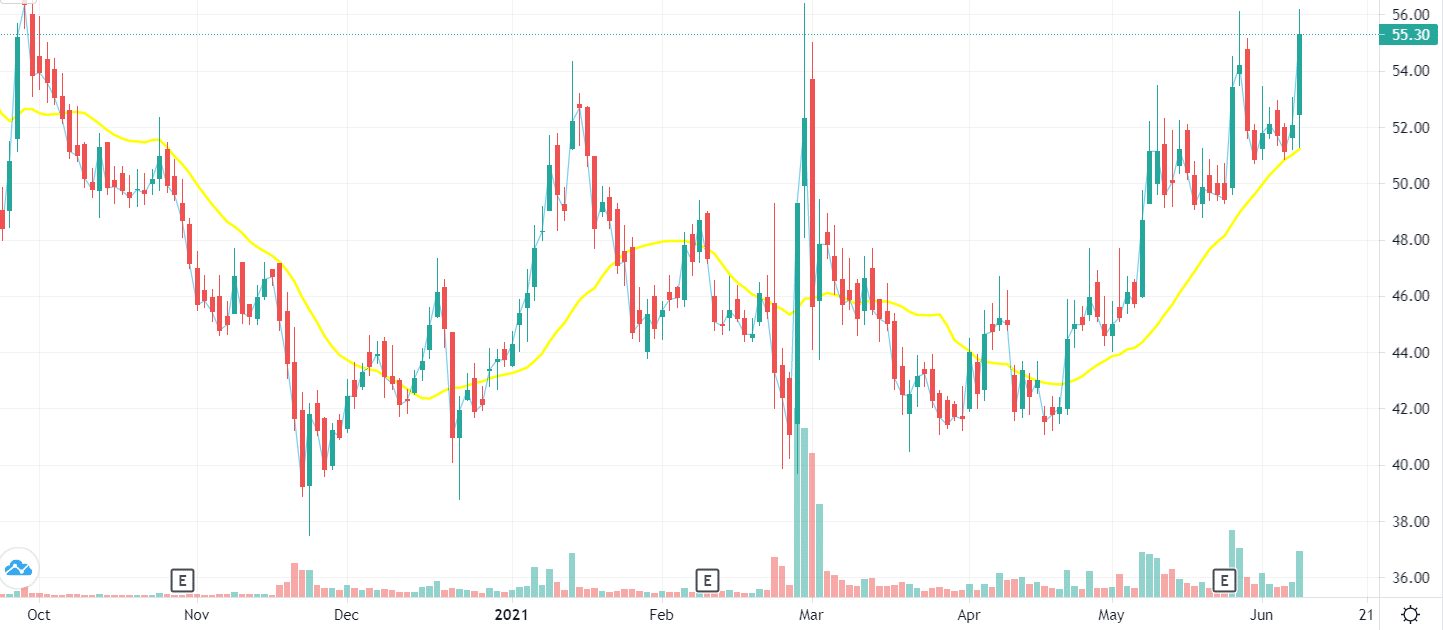
A Simple Moving Average is a technical indicator that flattens and smoothes the fluctuations in prices. It is a metric, which first calculates the arithmetic mean of the closing prices of a particular period and then depicts the curve of this movement on the chart. The closing prices of each day are added and then divided by the number of days.
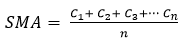
Where,
C = Closing price
n = Number of periods
The yellow curve in the chart above represents the 20-day moving average curve. There are several periods in which SMA can be taken into consideration. The most prominent ones are:
10-days SMA
20-days SMA
50-days SMA
200-days SMA
Ways of Interpretation:
Simple Moving Average can help in ascertaining if a stock price will continue moving in that direction or if it will reverse the trend. A trend change can be identified by sudden rise or fall in SMA line.
Exponential Moving Average (EMA)
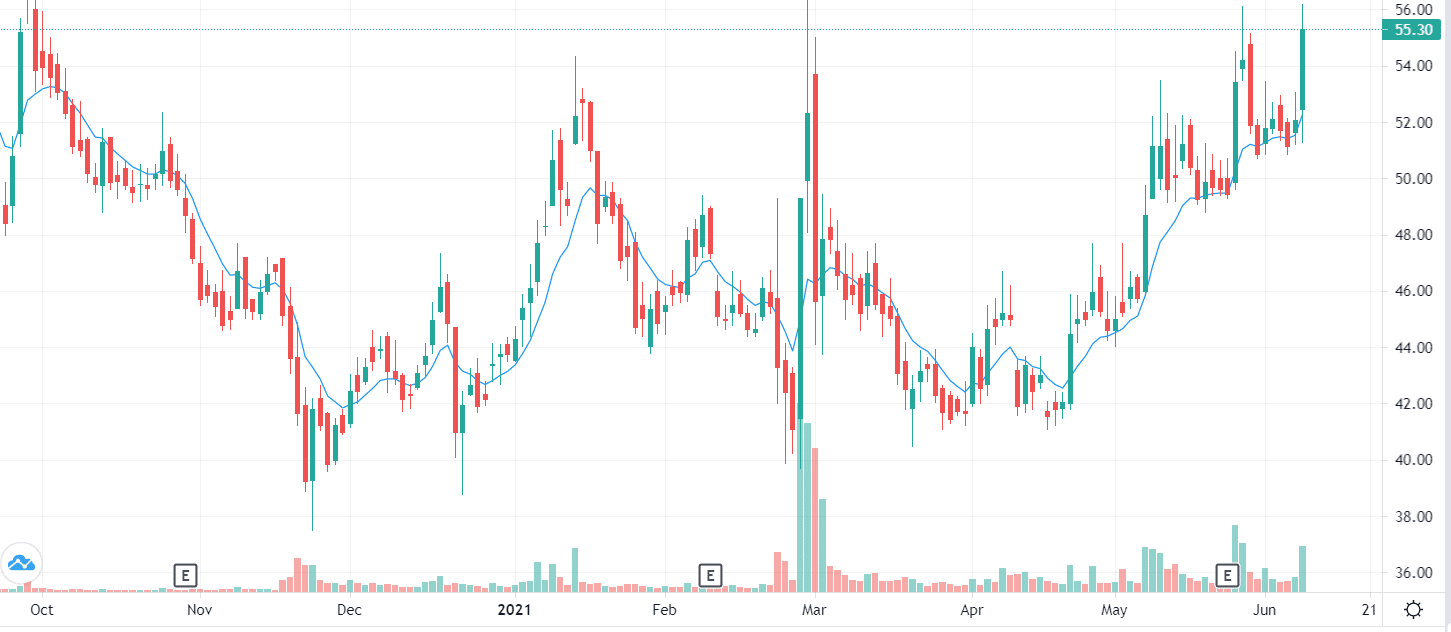
The Exponential Moving Average is a technical indicator, which is similar to simple moving average. It is a type of moving average, which says that the stock price would revolve around the line formed by plotting the trend of EMA prices. The only difference is that it gives more weight to recent prices. This is due to the concept that price discounts everything in the market. Giving more weight to recent prices implies that this indicator would be relatively more receptive to new information/news. The blue curve in the above chart represents the EMA.
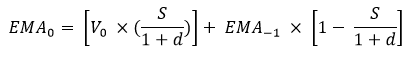
For calculating EMA, you need to first calculate SMA. The next step would be the calculation of the multiplier, which would help in assigning more weight to recent prices. The formula for computing the multiplier is as follows:-
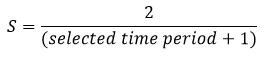
Where,
S = Smoothing Factor
Now, the EMA is calculated with the help of this smoothing factor. The formula for calculating the EMA is:
Golden Cross
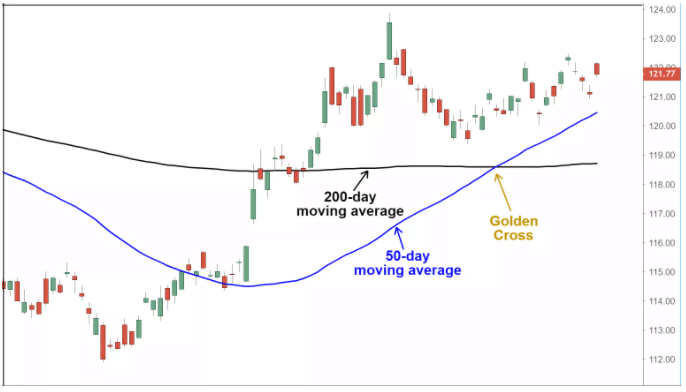
A Golden Cross is an indicator, which is interpreted using two types of moving averages. It signals a strong long-term bull market in the near future. It has more strength when high volumes accompany it.
It occurs when a short period moving average surpasses a long period moving average level and the stock price continues to rise. After the crossover, the long term moving average is believed to be a strong support level by many investors.
Death Cross
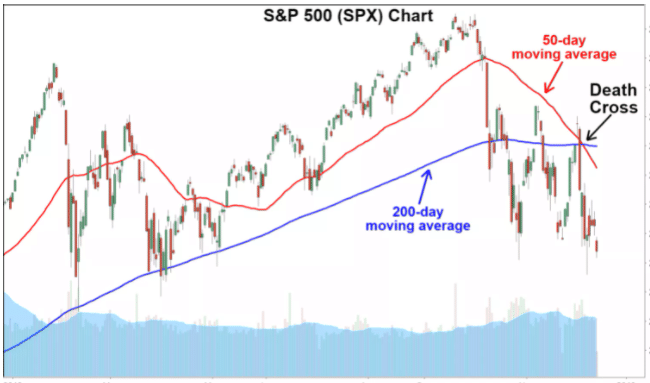
A Death Cross is an indicator which is interpreted with the help of two types of moving averages. It signals a strong long-term bear market in the near future. It has more strength when high volumes accompany it.
It occurs when a short period moving average descends below a long period moving average and the stock price continues to fall. After the crossover, the long-term moving average is believed to be a strong resistance level by many investors.
Moving Average Convergence Divergence (MACD)
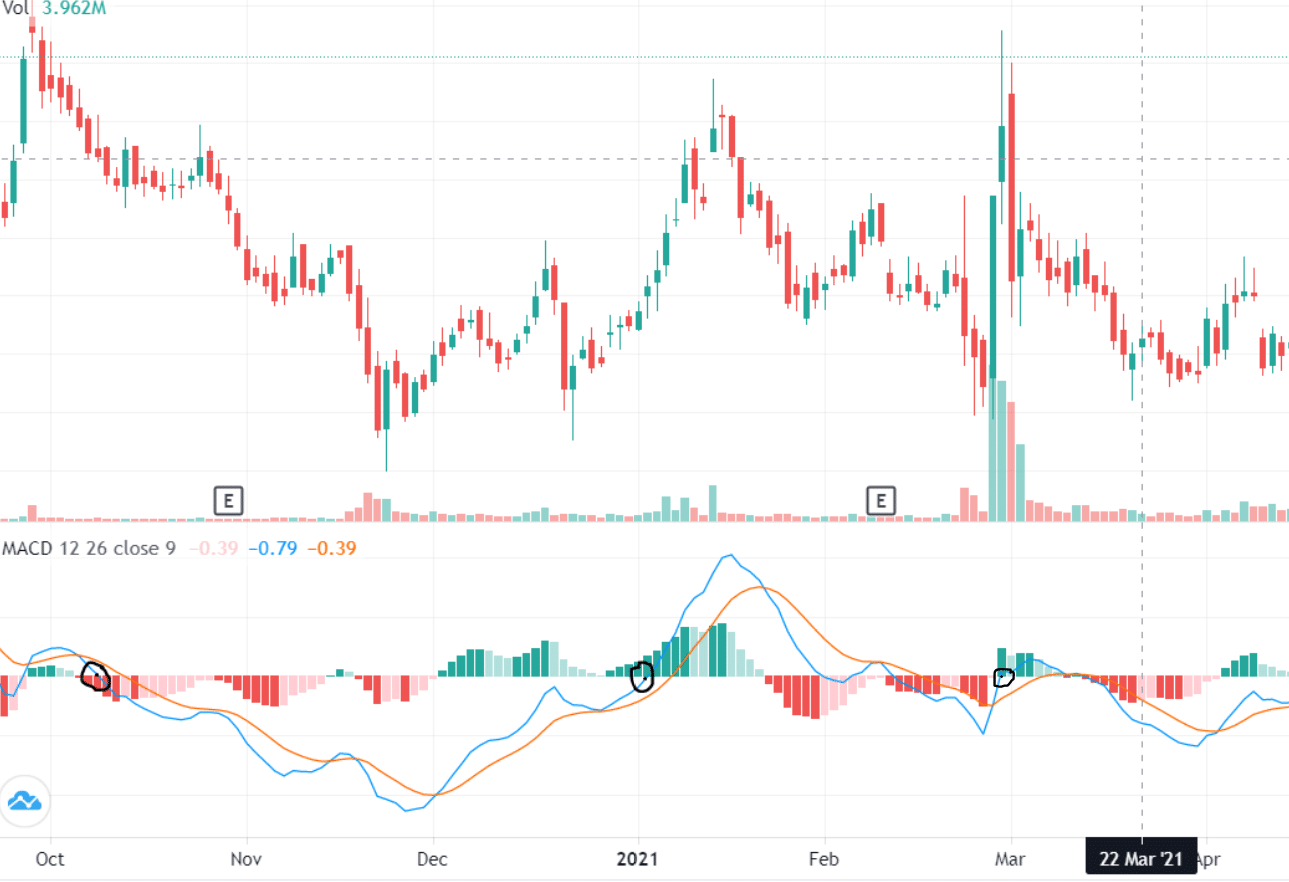
The MACD is a momentum indicator which helps in forecasting the volatility and the trends of the stocks in the market. It is one of the most important and effective indicators. It is computed by subtracting 26-period EMA from the 12-period EMA.

Ways of Interpretation:
When the MACD crosses above zero, it is considered a bullish sign and when MACD crosses below zero, it is considered a bearish sign. Higher/ lower the MACD above/below the line, stronger is the market sentiment.
The histogram represents the distance between the MACD & it’s signal line. The red line is the signal line and the blue line is the actual MACD. If the MACD is above the signal, the histogram will be above the MACD’s baseline, i.e. above 0. The histogram will be shown in green as it indicates a bullish sentiment. And if the MACD is below the signal, the histogram will be below the MACD’s baseline, i.e. below 0. The histogram will be shown in red as it indicates a bearish sentiment.
In the chart above, you can see that as soon as the MACD curve descends below the ‘zero’ level, a bearish trend starts and as soon as the MACD curve surpasses the ‘zero’ level, a bullish trend starts. These incidents have been encircled in black in the chart.
Relative Strength Index (RSI)
 RSI.png” alt=”” class=”wp-image-16905″ width=”696″ height=”443″/>
The RSI is a momentum indicator used to find the magnitude of price change to ascertain the market’s volatility. It indicates whether a stock is overbought or oversold. If the stock is overbought, then the traders sell the stock, and its price falls, and if the stock is oversold, then the traders buy the stock, and its price rises.
Ways of Interpretation:
There are two RSI reference levels: 30 & 70. If the RSI surpasses the 30 reference level, it is a bullish trend. If the RSI crosses the 70 reference level, it is a bearish trend.
(The perspective of many investors, related to RSI, may be different.)
Usually, 14 days of data points are considered to calculate the initial RSI value.
Formula:
RSI-Formula.png” alt=”” class=”wp-image-16906″ width=”318″ height=”97″/>Technical Indicators in MarketXLS
By looking at the formulas and the calculation steps of various indicators, you might have understood that calculating them and its trend line is very tedious and time consuming. It is not the investor’s work to calculate them. The investors just have to interpret them to make quick and effective trading and investment decisions. The software does the back-end job for you. MarketXLS provides ready to use functions and formulas using which you can easily interpret any technical indicator and make your investment decisions easier and faster.
Step-by-Step Procedure To Interpret Technical Indicators Using MarketXLS
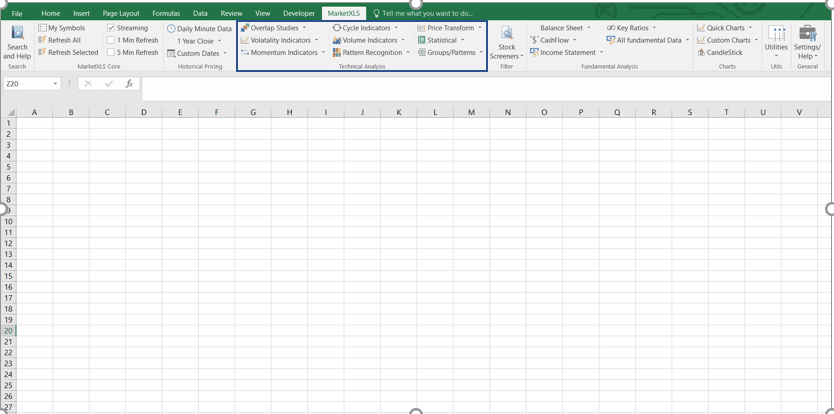
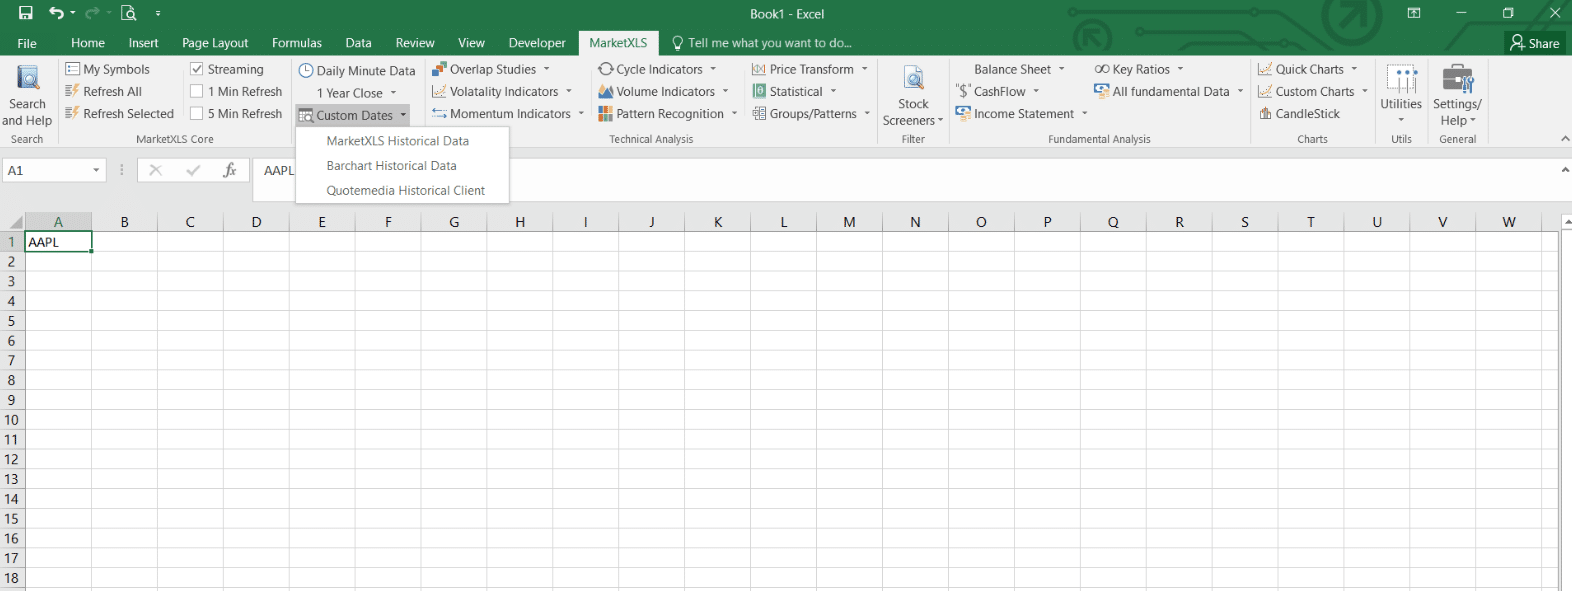
- To identify and interpret technical indicators, firstly we need to get the data of the stock. Here we just need to add the ticker in any cell and select custom dates and get the historical data.
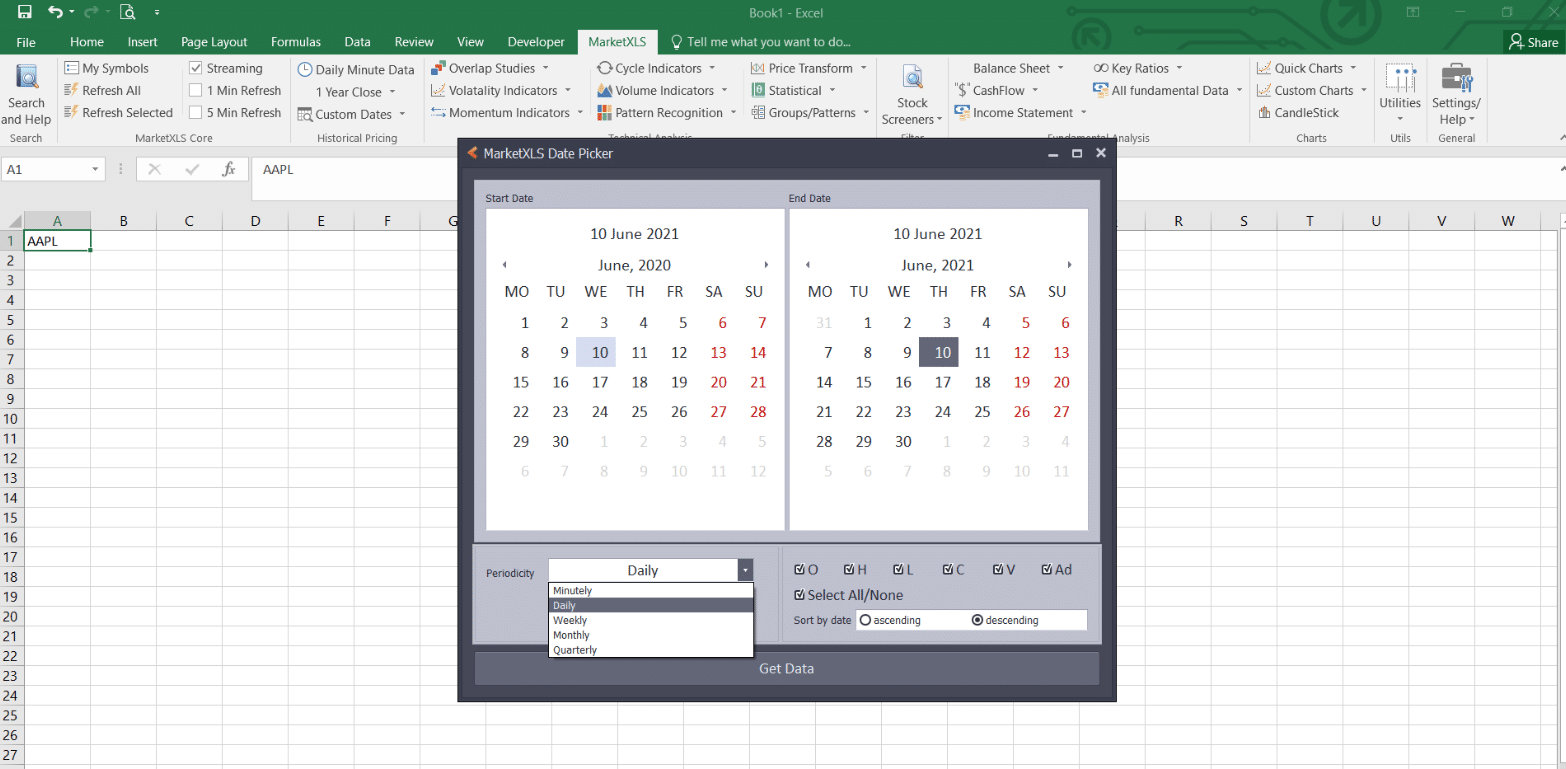
2. A dialog box will appear and you will be prompted to select the dates for the period you wish to analyze. You can also select the time frame or the periodicity for which you wish to pull the data. The options available are minutely, daily, weekly, monthly and quarterly. In this case, we will select the dates as 10th June 2020 – 10th June 2021 and the periodicity as daily. In order to analyze technical indicators, you will need the open, high, low and close (OHLC) prices of the whole period. Hence make sure that you have at least ticked the OHLC check boxes which are given in the bottom right of the dialog box.
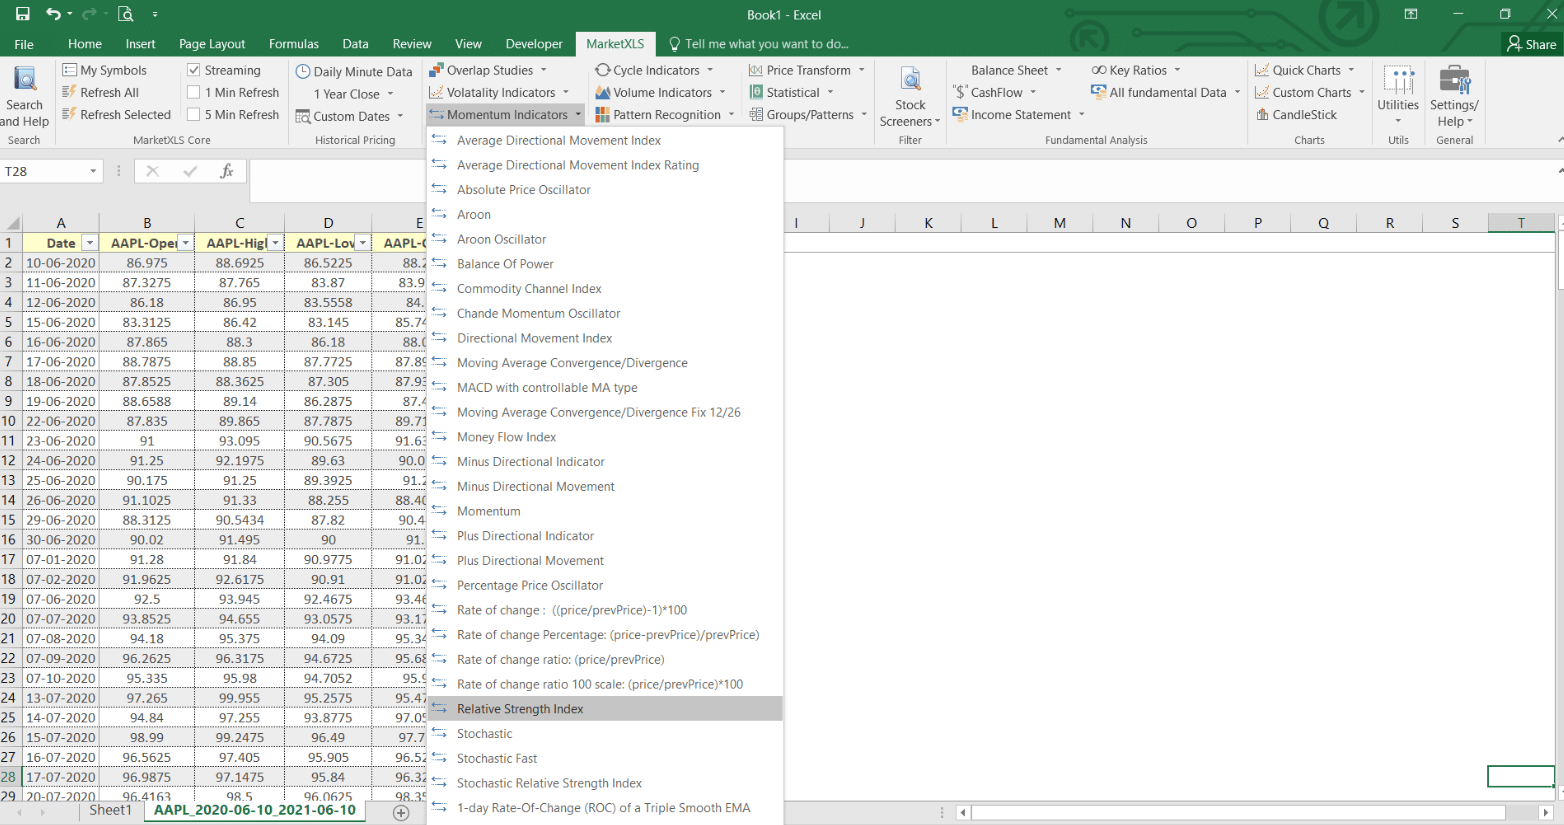
3. Once you have the data generated, you can generate your technical indicators by clicking on any of the dropdown menus given beside the different categories of technical indicators. A downward arrow indicates dropdowns.
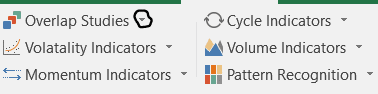
For example, in the snapshot below, we have decided to use Relative Strength Index, which is a part of the dropdown option of Momentum Indicators.
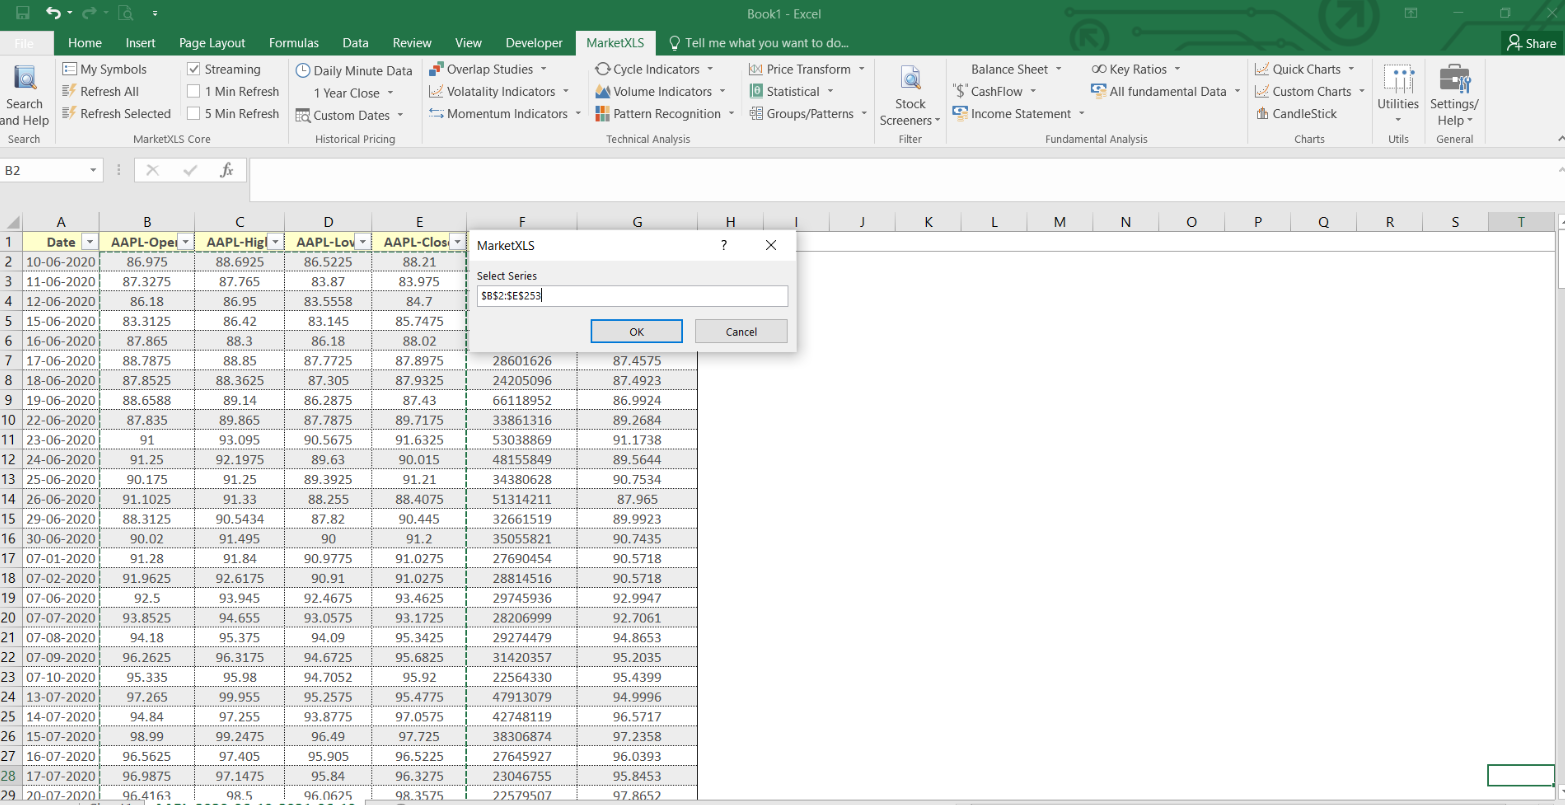
4. A pop-up box will appear where you will be asked to select the series of cells where the data of OHLC prices lie. You can select the whole series of Open, High, Low and Closing prices of each day between 10 June 2020 and 10 June 2021.
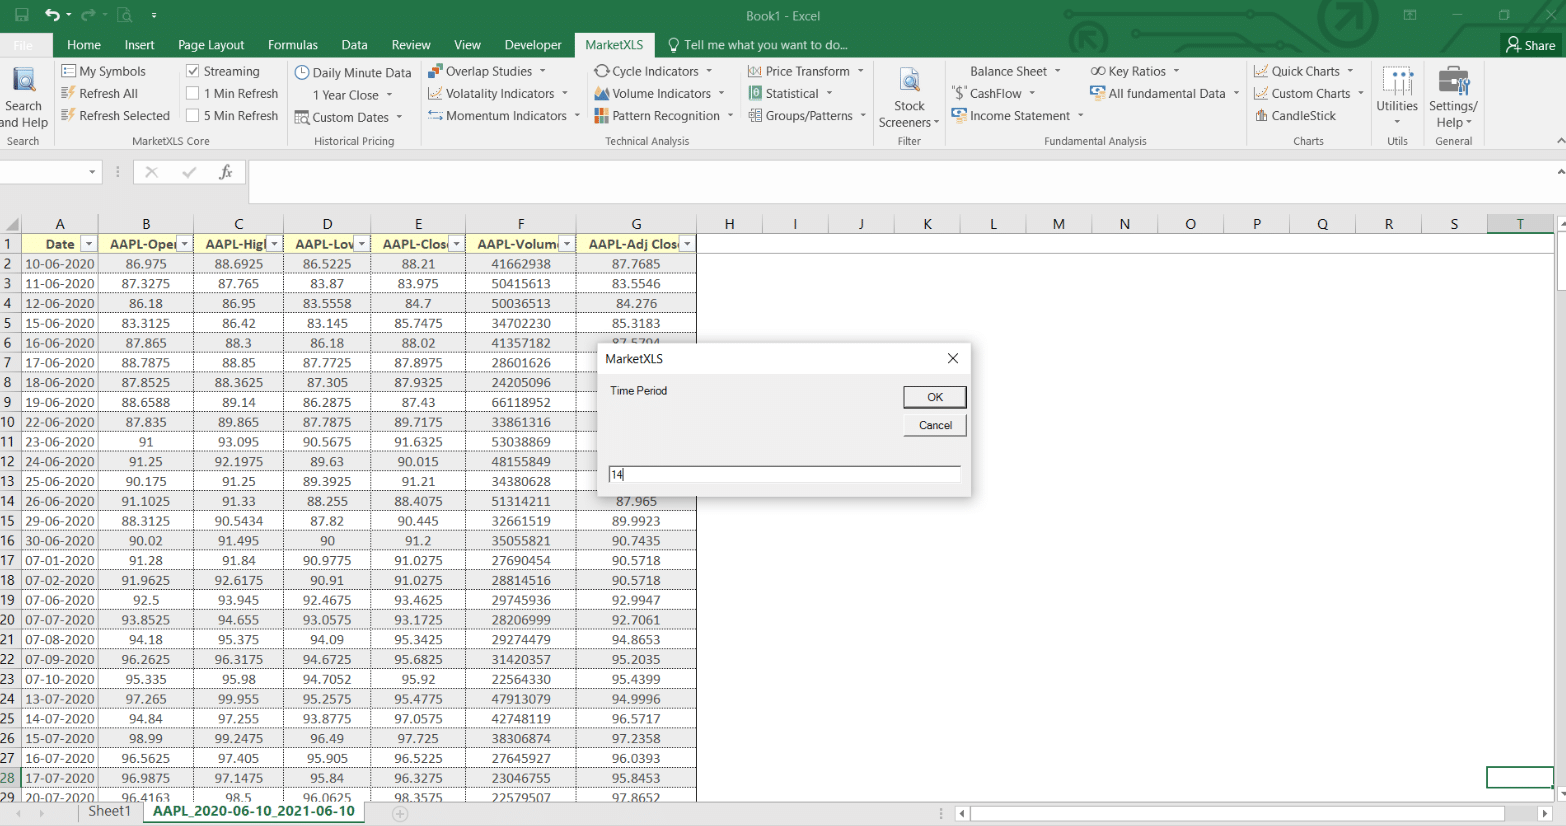
5. Next, you will be asked the time period on the basis of which the software will pull the RSI values. As mentioned earlier, the default time period for calculating RSI is 14 days.
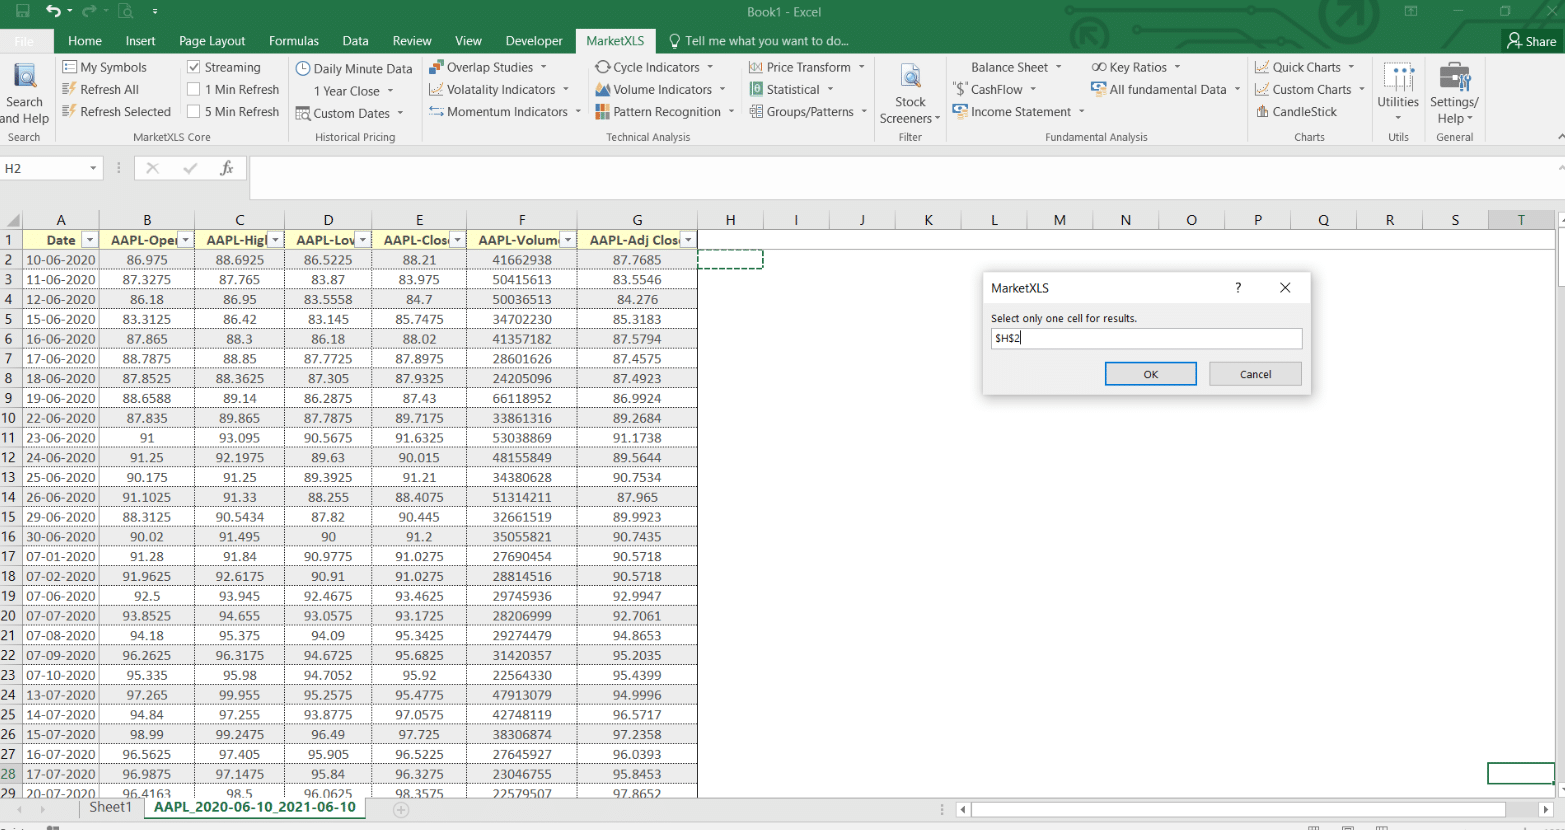
6. After clicking ‘Ok’, you will be prompted to select only one cell where you want the software to display the results of the values of RSI. It would be advised that you skip the first row for the header of the column of values and select a cell in the 2nd row. For example, here, I have left the first row for the header and selected the cell named ‘H2’ for displaying the results.
7. After clicking ‘Ok’, you will see that a whole new column, named ‘Relative Strength Index’ has been added. This column displays daily values of RSI.
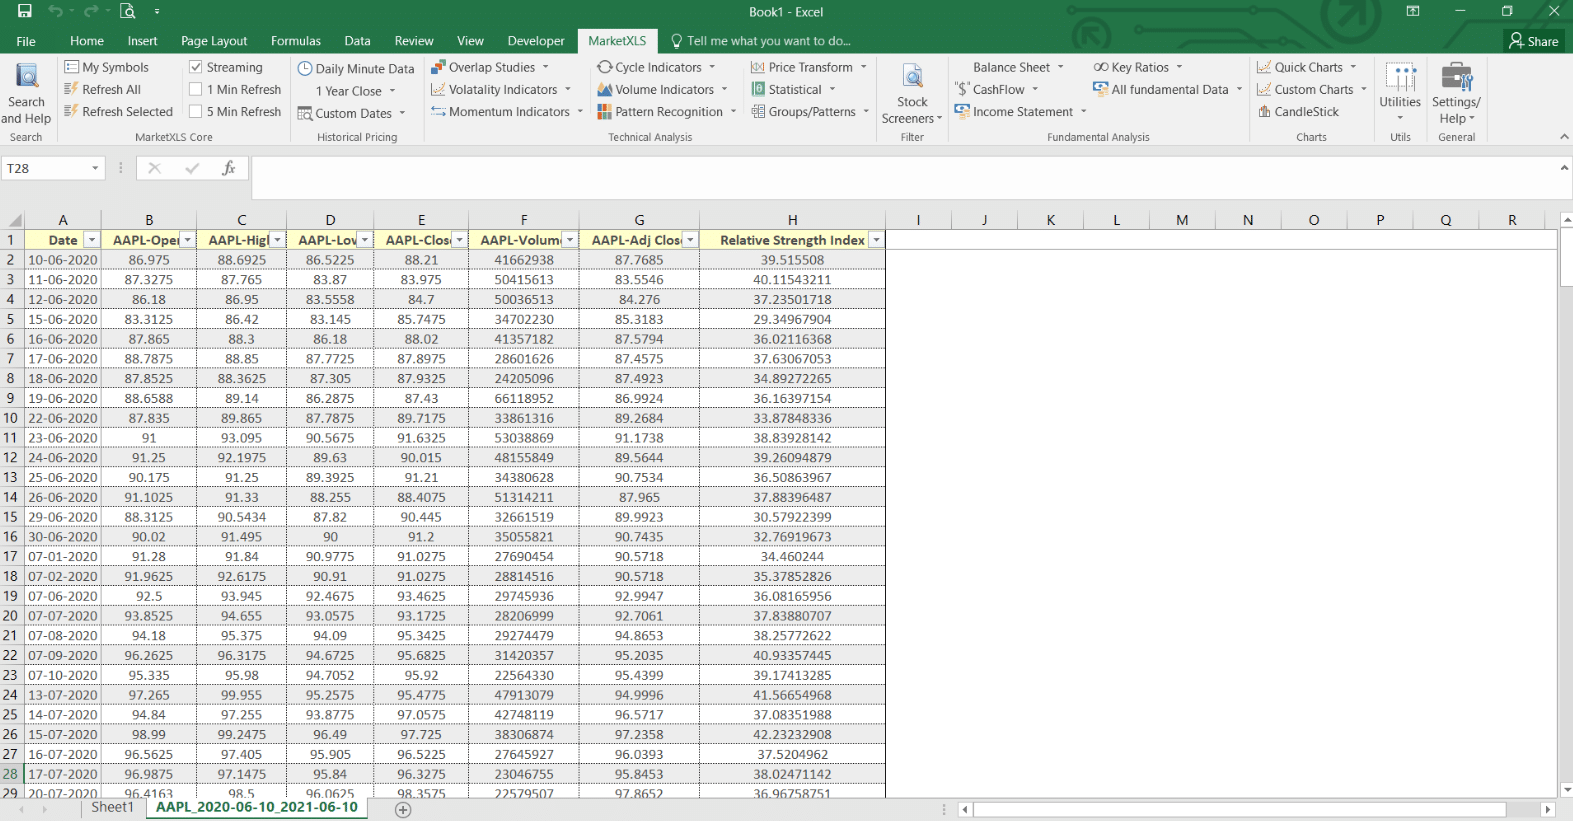
Interpretation: There are two RSI reference levels: 30 & 70. If the RSI surpasses the 30 reference level, it is a bullish trend. If the RSI crosses the 70 reference level, it is a bearish trend.
(The perspective of many investors, related to RSI, may be different.)
The Bottom Line
I have explained the meanings and interpretations but you have to understand that different indicators have to be used under different circumstances and for different types of strategies.
You cannot take the same indicator and use it across the board for all stocks, strategies & events. You have to have a specific environment that is suitable for that indicator.
The software makes your work easier, by providing a ready-to-use list of indicators. By the use of this list, you can extract values of any indicator. You can use them for all the stocks and for any time period in the past.
Disclaimer
None of the content published on marketxls.com constitutes a recommendation that any particular security, portfolio of securities, transaction, or investment strategy is suitable for any specific person.
The author is not offering any professional advice of any kind. The reader should consult a professional financial advisor to determine their suitability for any strategies discussed herein.
The article is written to help users collect the required information from various sources deemed to be an authority in their content. The trademarks, if any, are the property of their owners, and no representations are made. All trademarks referenced are the property of their respective owners. Other trademarks and trade names may be used in this document to refer to either the entity claiming the marks and names or their products. MarketXLS disclaims any proprietary interest in trademarks and trade names other than its own or affiliation with the trademark owner.
Reference
https://www.investopedia.com/terms/m/movingaverage.asp
Image Source
https://www.tradingview.com
https://www.investopedia.com/terms/r/rsi.asp


