
Introduction
Monte Carlo Simulation, in simple words, is a risk analysis technique that builds models of potentials results of portfolio returns. It is an excellent risk analysis technique used by many investors of The Wall Street to rate their portfolio on a risk-return basis.
The result of this model would be an array of possible outcome values, which could be very difficult to assess and interpret. This model is combined with a simulation for easy interpretation. Simulation is a virtual representation of the problem and the solution.
You might be still confused, but before proceeding with the next part, keep this thing in mind:
Monte Carlo Simulation considers various inputs and various consequences of those inputs and tries to eliminate uncertainties. It facilitates analysts in decision-making.
Application of the Monte Carlo Simulation
The Monte Carlo Simulation tries to rule out various uncertainties, as it is a very flexible model. We can change the inputs according to the situation, and it automatically models a range of possible outcomes.
This approach is a computer-based method that uses statistical sampling to build a model of a possible range of results (a probability distribution) for those factors that have an element of uncertainty.
I hope you guys are with me because we will be understanding a straightforward situation in which this approach can be used.
Example
Consider a middle-class working couple who do not have a very extravagant lifestyle. The couple have kept their savings in FDs . Their objective is to retire before their fifties and have $600,000 saved for their children’s education and live their second innings lavishly. An analyst considers their situation, needs, and requirements and runs an analysis. He finds out that their savings are enough, but they need to start investing in the stock market to fulfill those requirements. The interest provided by the FD would not be enough to fulfill their requirements. The analyst provides a solution that they should invest 60% of their savings in stocks and the rest in the government bonds. The couple is reluctant to invest more than half money in stocks, and they want to keep a part of their money in the FD. Considering these factors, analyst makes certain adjustments and reruns the simulation.
Solution
The analyst suggests the couple to delay their retirement by five years if they insisted on investing in FDs and increase their monthly savings by 5% at least, which could be invested in stocks.
I hope now you people might have got a better picture of the simulation’s approach.
Monte Carlo Simulation in MarketXLS
‘Formula’
There is a formula in MarketXLS for the Monte Carlo Simulation of a portfolio. The formula that needs to be entered in excel is as follows:
=MonteCarloSimulation(Portfolio, Periods)
The Parameters:
1) Portfolio means the stock ticker on which you want a Monte Carlo Simulation analysis.
2) Periods are the number of years for which you want to analyze.
This is a snapshot of the result. In this example, we have taken ‘MSFT’ as the Portfolio and ‘6’ as the period.
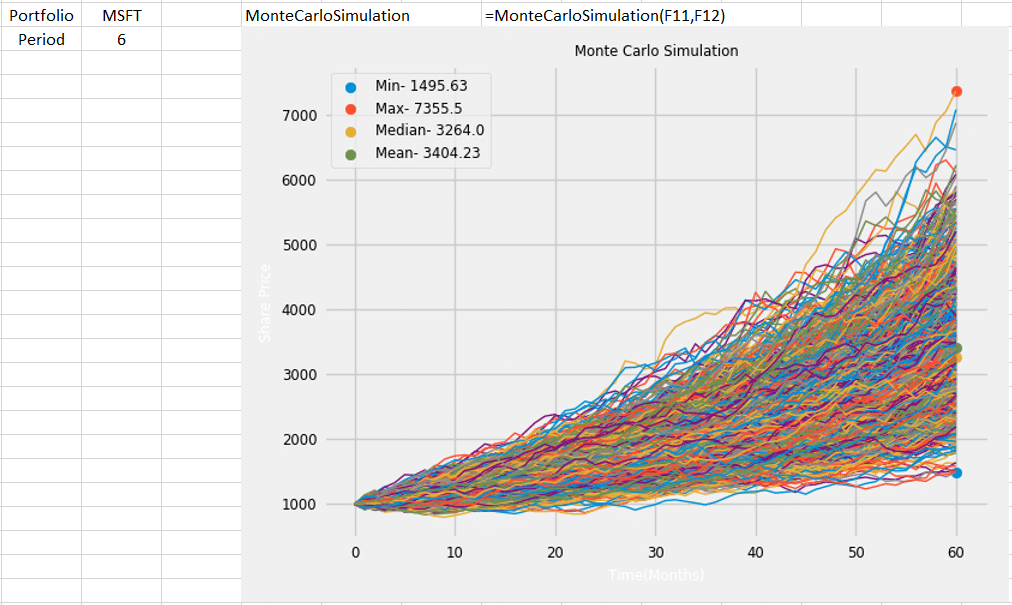
Output: MarketXLS expected return and volatility for your portfolio through annualization of outputs from historical returns. This data is put through 1000 different simulations over a 5-year future period and returns the mean and median of the resultant simulation.
‘Template’
There is a ready-to-use template in MarketXLS that facilitates Monte Carlo Simulation. This tracking spreadsheet enables you to keep track of your investment portfolio.
Changes in both the growth rate (g) in the free cash flows (FCF) and the cost of capital (k) of the asset can be accounted for, using MarketXLS. Coupling the Discounted Cash Flow model (DCF) and Monte Carlo Simulations together more closely approximates the ‘true’ net present value by incorporating a set of dynamic variables. The complementary use of the Monte Carlo Simulation makes the DCF method a more precise and reliable means of asset valuation.
Let us look at the template for a better understanding.
‘Introduction’ Sheet
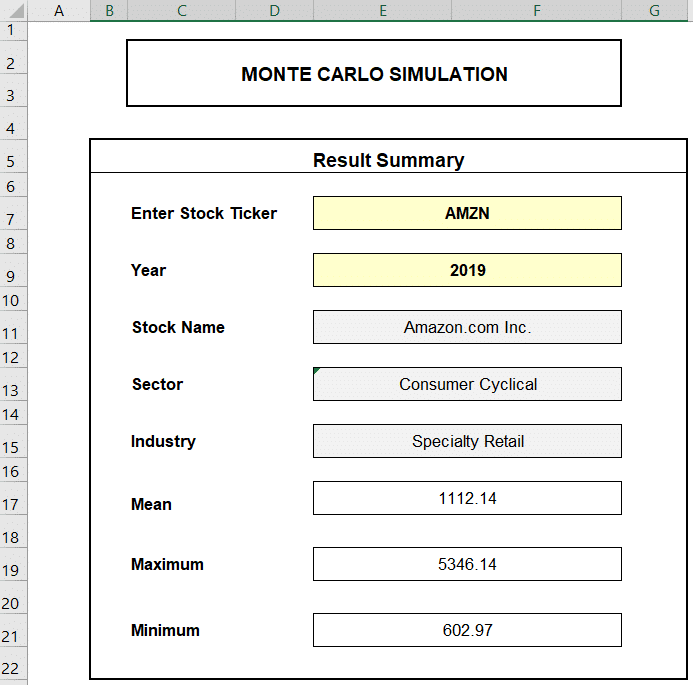
This sheet contains all those things that you need to know before working on this template. It shows the result summary of the stock you entered, a brief introduction of the Monte Carlo Stimulation model, and the rationale to use this template.
All you need to do is enter Stock Ticker in cell E7 of this sheet to get the result summary.
In this example, we have taken the stock of Amazon and 2019 as our base year. The template based on specific calculations automatically gives the result summary. It consists of the stock name; sector; industry; mean, maximum and minimum value of the resultant simulation.
For detailed analysis, switch to the Calculations worksheet.
‘Calculations’ Sheet

The investor needs to enter the mean and standard deviation of the expected growth rate for the stock entered in the ‘Introduction’ sheet.
The investor needs to enter the mean and standard deviation of the discounting rate they want to use to calculate intrinsic value.
Lastly, the investor needs to enter the long-term growth rate that he desires.
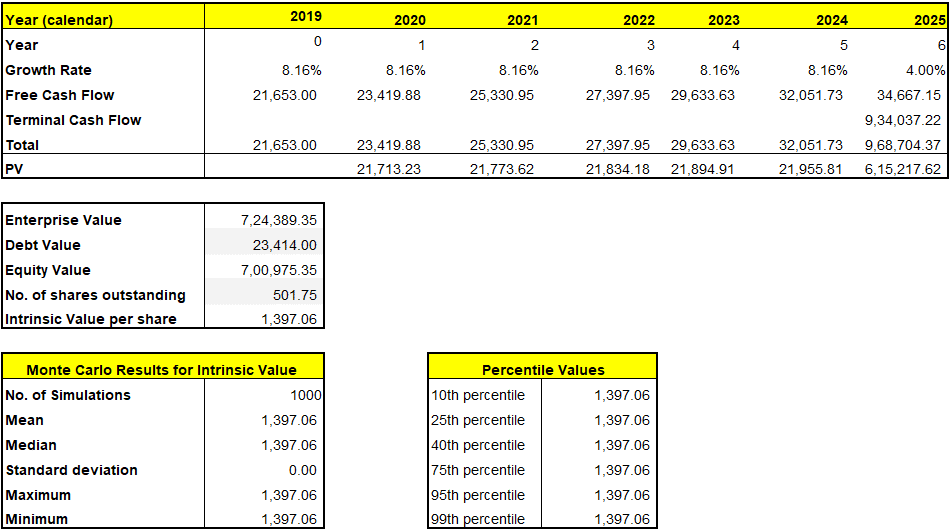
This part of the template provides the following information:
• Growth Rate
• Free Cash Flow at the end of every year for the next six years
• Terminal Cash Flow at the end of six years
• Total Value
It also gives information on the stock that you have entered in the ‘Introduction’ sheet.
It gives Monte Carlo results for the Intrinsic Value of the stock entered.
The Bottom Line
In short, it is a random sampling statistical technique to solve a statistical complication, combined with a simulation for easy interpretation.
The Monte Carlo Simulation finds its usage in various fields like corporate finance, portfolio management, wealth management, and other finance-related statistical problems.
A shortcoming of this simulation would be that it doesn’t consider bear markets, depressions, recessions, or any other catastrophe that might impact the calculated results.
For more such exciting content, please visit https://www.marketxlswp.com/
All images and graphics are from the software itself – MarketXLS.
Disclaimer
None of the content published on marketxls.com constitutes a recommendation that any particular security, portfolio of securities, transaction, or investment strategy is suitable for any specific person.
The author is not offering any professional advice of any kind. The reader should consult a professional financial advisor to determine their suitability for any strategies discussed herein.
The article is written to help users collect the required information from various sources deemed to be an authority in their content. The trademarks, if any, are the property of their owners, and no representations are made. All trademarks referenced are the property of their respective owners. Other trademarks and trade names may be used in this document to refer to either the entity claiming the marks and names or their products. MarketXLS disclaims any proprietary interest in trademarks and trade names other than its own or affiliation with the trademark owner.
Reference
https://www.investopedia.com/articles/investing/112514/monte-carlo-simulation-basics.asp


