
How Can We Help?
Historical Fundamental Functions
This category of function can be accessed through Excel’s in built function menu as shown below:
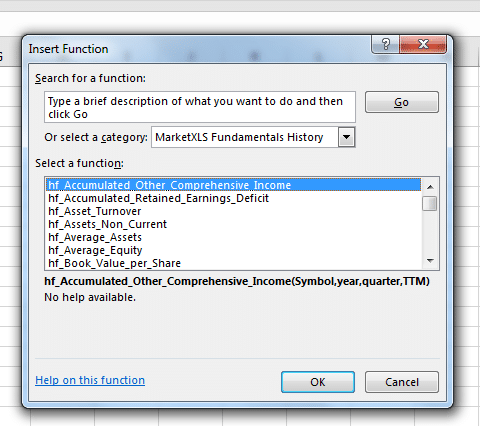
All functions in this category start from a prefix “hf_” hf stands for “Historical Fundamentals”. These functions can be used to get historical values (quarterly, yearly, TTM) of fundamentals from a company’s financial statements. The values returned from these functions will exactly match the values that you would get from SEC filings.
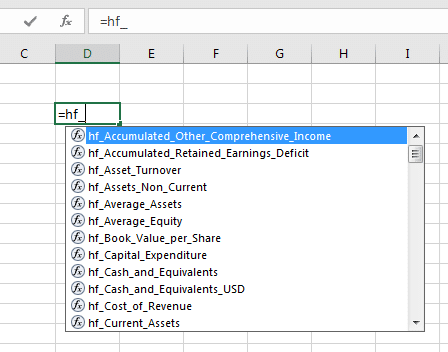
You can just start typing =hf_ and Excel will also give a list of all functions available like shown below:
All these functions have a consistent format of usage which is explained with examples below:
Revenue of MSFT Q3 2013: =hf_revenue(“MSFT”,”2013″,”3″)
Revenue of MSFT Year 2015 : =hf_revenue(“MSFT”,”2015″)
TTM Revenue of MSFT Year 2015 Q3 : =hf_revenue(“MSFT”,”2015″,”3″,”TTM”)
Following are the arguments for these functions…
- Symbol – Any US stock symbol
- Year – Year as string. Enclose the year number in Double quotes if entering in the formula itself. You can also refer to a cell that carries the year numeric value.
- Optional – Quarter Number – Enclose the Quarter number in Double quotes if entering in the formula itself. You can also refer to a cell that carries the year numeric value.
- Optional TTM – Type “TTM” within double quotes
Important Note : All Quarterly values refer to Calendar Quarters and not the fiscal quarters. So, when you ask to get data for Q1 it means data for January to March End. Now this time period could actually be Quarter 3 in some companies whose
Fiscal year is from April to March.
If you just want to get the last quarter value then simply =hf_revenue(“MSFT”,”lq”)
lq = last quarter.
If you just want to get the last quarter value then simply =hf_revenue(“MSFT”,”ly”)
ly = last quarter.
If you want to get the quarter before the last quarter then use =hf_revenue(“MSFT”,”lq-1″)
If you want to get the quarter before the last year then use =hf_revenue(“MSFT”,”ly-1″)
So, instead of using the actual year and quarter value, you should be able to use “lq-x”, where x is the number that represents how many quaters you want to go back from the last quarter. The same works exactly the same way for “ly-x”.
Here is a template on how to use Historical Fundamentals.
Important Note: All functions that return a ratio, like ROE, ROA, Margins etc are reported for trailing 12 months.
These functions are particularly useful when you want to analyse the fundamental strength of a company over time. Since, these functions are in Excel you can use these in many different ways like for comparing multiple companies for multiple metrics over time, looking at trends of revenue, margins and other key indicators.
A total of 100 indicators are available as listed below:
Income Statement
Name
Revenues
Revenues (USD)
Cost of Revenue
Gross Profit
Research and Development Expense
Selling, General and Administrative Expense
Earning Before Interest & Taxes (EBIT)
Earning Before Interest & Taxes (USD)
Interest Expense
Income Tax Expense
Net Income
Preferred Dividends Income Statement Impact
Net Income Common Stock
Net Income Common Stock (USD)
Net Income from Discontinued Operations
Earnings per Basic Share
Earnings per Basic Share (USD)
Earnings per Diluted Share
Weighted Average Shares
Weighted Average Shares Diluted
Dividends per Basic Common Share
Cash Flow Statement
Name
Net Cash Flow from Operations
Depreciation, Amortization & Accretion
Net Cash Flow from Investing
Capital Expenditure
Net Cash Flow from Financing
Issuance (Repayment) of Debt Securities
Issuance (Purchase) of Equity Shares
Payment of Dividends & Other Cash Distributions
Effect of Exchange Rate Changes on Cash
Net Cash Flow / Change in Cash & Cash Equivalents
Balance Sheet
Name
Total Assets
Current Assets
Assets Non-Current
Cash and Equivalents
Cash and Equivalents (USD)
Trade and Non-Trade Receivables
Goodwill and Intangible Assets
Inventory
Total Liabilities
Current Liabilities
Liabilities Non-Current
Total Debt
Total Debt (USD)
Trade and Non-Trade Payables
Shareholders Equity
Shareholders Equity (USD)
Accumulated Retained Earnings (Deficit)
Accumulated Other Comprehensive Income
Metrics & Ratios
Name
Asset Turnover
Average Assets
Book Value per Share
Current Ratio
Debt to Equity Ratio
Dividend Yield
Earnings Before Interest, Taxes & Depreciation Amortization
Earnings Before Interest, Taxes & Depreciation Amortization (USD)
EBITDA Margin
Earnings before Tax
Average Equity
Enterprise Value
Enterprise Value over EBIT
Enterprise Value over EBITDA
Free Cash Flow
Free Cash Flow per Share
Foreign Currency to USD Exchange Rate
Gross Margin
Invested Capital
Invested Capital Average
Market Capitalization
Profit Margin
Price Earnings Damodaran Method
Price to Earnings Ratio
Price to Sales Ratio
Price Sales Damodaran Method
Price to Book Value
Return on Invested Capital
Sales per Share
Payout Ratio
Return on Average Assets
Return on Average Equity
Return on Sales
Tangible Asset Value
Tangible Asset Book Value per Share
Working Capital


